Words by Heather Sykes, Creative Writing and Illustration Student. Graphs by Aleksandr Mäeots, Film Production Student. Further material was written by Dr Sian Evans.
Survey Highlights
In 2021-2022 and again in the 2022-2023 academic years, the university asked students and staff about sustainability knowledge and awareness, this is a longitudinal study going back a number of years so we can view trends. Here we take a look at a few key points from the latest data. Scroll down to see data from 2021-2022. To read the results from the SOS UK sustainability skills survey 2022 from our students https://susthingsout.com/what-do-you-know-about-sustainability/
Student and Staff Sustainability Awareness and Behaviour Report 2022 -2023
Sample Characteristics
Student Survey
There was a marked increase in response rate to the student survey this year to n281 from n137 in 2021-22, which the COVID-19 pandemic had strongly impacted. Whilst this is an improvement, clearly a larger sample size would enhance the reliability of survey results, as there are a number of internal sample biases. For example, gender bias has unfortunately risen with 83% female representation compared to 75% the previous year. The sample contains a large (unrepresentative) number of mature students, with 41% of responses from those over 25. There was also less diversity in responses across university schools this year, with particularly low representation from business, psychology, sport, and the medical school (all <5%). These sample biases require consideration during the analysis and efforts to overcome these integrated into next year’s invitation to respond.
Staff Survey
There was a marked decrease in response rate to the staff survey this year dropping to n380 from n502 in 2021. However, gender representation has remained relatively stable across the two surveys (roughly 72% female) with a good level of diversity across age, employment status (permanent/part-time staff) and number of years of service. The reasons for the drop in participation are unknown but efforts to increase this will be implemented in next year’s survey.
Sustainability Awareness
The surveys suggest that staff continue to have more awareness of the University’s sustainability efforts across all activities (see Table 1). Despite this, it is encouraging that 2022 saw increasing levels of student full awareness of the University’s sustainability efforts across nearly all areas.
Table 1 – Percentage of Staff and Students “Very Aware” of the University’s Sustainability Efforts
| Awareness of University of Worcester’s efforts to: | % Staff “Very Aware” | % Students “Very Aware” | ||||
| 2021 | 2022 | % change | 2021 | 2022 | % change | |
| Conserve Energy | 36 | 33 | -3 | 17 | 22 | 5 |
| Encourage people to take a bus | 21 | 17 | -4 | 11 | 14 | 3 |
| Encourage cycling | 36 | 31 | -5 | 20 | 19 | -1 |
| Promote car sharing | 25 | 20 | -5 | 8 | 15 | 7 |
| Promote recycling | 50 | 49 | -1 | 35 | 36 | 1 |
| Promote food from sustainable sources | 28 | 33 | 5 | 23 | 23 | 0 |
| Reduce Carbon emissions | 31 | 34 | 3 | 21 | 24 | 3 |
| Manage areas for wildlife | 36 | 52 | 16 | 21 | 28 | 7 |
| Promote the UN’s SDGs | 28 | 33 | 5 | 16 | 23 | 7 |
| Embed sustainability in the curriculum | n/a | 31 | n/a | n/a | 20 | n/a |
| Provide Carbon Literacy training | n/a | 21 | n/a | n/a | 15 | n/a |
Amongst the staff, it appears that efforts to publicise sustainability initiatives and activity have been particularly successful in raising awareness of ‘promoting food from sustainable sources’, ‘reducing carbon emissions’, ‘managing areas (on campus) for wildlife’ and ‘promoting the UN SDGs’, which reflect the success of recent campaigns. However, unfortunately, awareness of other activities amongst staff has declined.
Overall, the promotion of recycling on campus is the most widely recognised of all activities promoted by the University for both students and staff, whilst encouraging people to take a bus had the fewest “very aware” by both groups in 2022-3.
The figures summarising the complete lack of awareness of the University’s sustainability efforts highlight that overall, very few staff have no awareness at all (<15% across all categories), but unfortunately, it appears that this number has increased since 2021 (see Table 2). It is particularly important that staff are made aware of initiatives around the promotion of SDGs, embedding sustainability in the curriculum and carbon literacy training opportunities (which all had 15% or more staff stating that they were “Not at all Aware”.
Table 2 – Percentage of Staff and Students “Not at All Aware” of the University’s Sustainability Efforts
| Awareness of University of Worcester’s efforts to: | % Staff “Not at all Aware” | % Students “Not at all Aware” | ||||
| 2021 | 2022 | % change | 2021 | 2022 | % change | |
| Conserve Energy | 4 | 7 | +3 | 17 | 16 | -1 |
| Encourage people to take a bus | 8 | 14 | +6 | 23 | 22 | -1 |
| Encourage cycling | 5 | 8 | +3 | 17 | 19 | +2 |
| Promote car sharing | 7 | 13 | +6 | 24 | 22 | -2 |
| Promote recycling | 2 | 6 | +4 | 12 | 13 | +1 |
| Promote food from sustainable sources | 8 | 11 | +3 | 20 | 19 | -1 |
| Reduce Carbon emissions | 4 | 9 | +5 | 20 | 20 | 0 |
| Manage areas for wildlife | 7 | 6 | -1 | 23 | 20 | -3 |
| Promote the UN’s SDGs | 13 | 15 | +2 | 26 | 21 | -5 |
| Embed sustainability in the curriculum | n/a | 15 | n/a | n/a | 22 | n/a |
| Provide Carbon Literacy training | n/a | 24 | n/a | n/a | 30 | n/a |
The figures confirm students are generally less aware of sustainability initiatives than staff but that this is improving slightly across most activities. Increasing student awareness of the University’s sustainability initiatives must remain a high priority, particularly concerning carbon literacy training, embedding sustainability in the curriculum, promoting SDGs and encouraging public and shared transport (which all exceeded 20% of non-awareness).
In 2022 an additional question was asked about student understanding of Fairtrade. The results suggest the majority of students believe they have some idea of what it is (93%), with 40% of these claiming “I completely get it”. About a third of students were receptive to liking “information about Fairtrade and what it means” (35%).
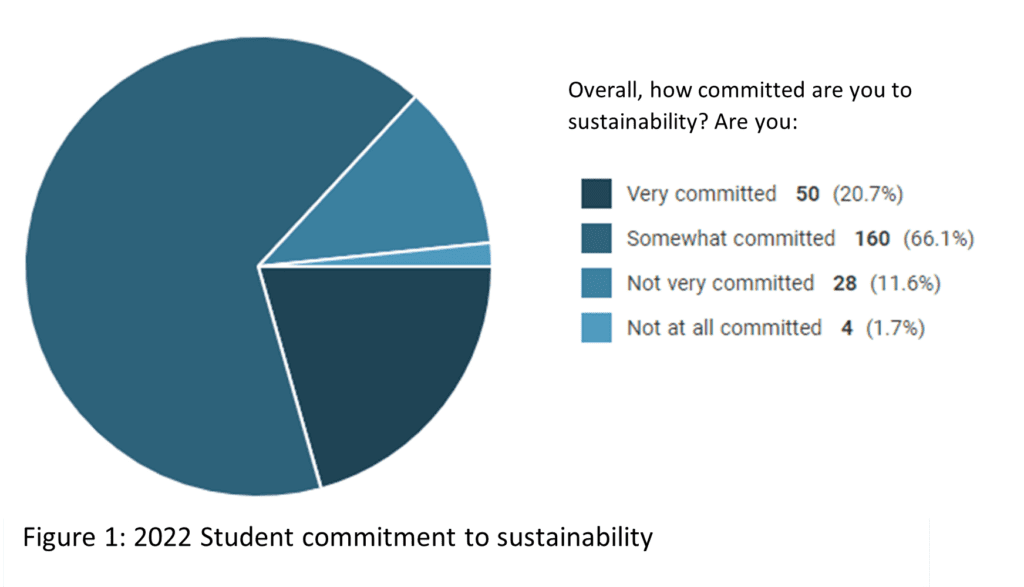
Students’ commitment to sustainability for 2022 is highlighted in Figure 1 below. Those who felt “very committed” to sustainability remained stable between 2021 and 2022 at 21%, however, there was a slight increase in those somewhat committed up to 66% from 62% the previous year.
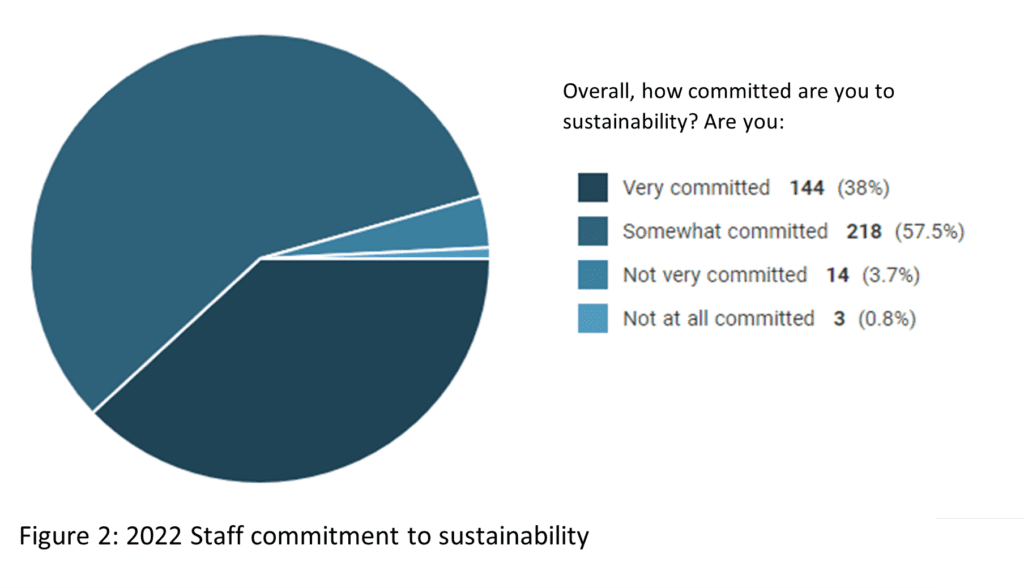
Staff commitment to sustainability remained relatively constant across the two survey years, with results indicating staff are generally more committed to sustainability than students (see Figure 2).
University’s Sustainability Success
The surveys request students and staff to rate/grade a range of the University’s sustainability efforts on a scale of very good to very poor. Table 3 provides a summary of the percentage of activities rated “very good”.
Table 3 – Percentage of Staff and Student rating the University’s Sustainability Efforts “Very Good”
| Rating/Grading of University of Worcester’s efforts: | % Staff “Very Good” | % Students “Very Good” | ||||
| 2021 | 2022 | % change | 2021 | 2022 | % change | |
| Conserve Energy | 16 | 16 | 0 | 12 | 18 | +6 |
| Encourage people to take a bus | 10 | 8 | -2 | 11 | 11 | 0 |
| Encourage cycling | 18 | 16 | -2 | 16 | 15 | -1 |
| Promote car sharing | 10 | 10 | 0 | 9 | 13 | +4 |
| Promote recycling | 30 | 31 | +1 | 31 | 26 | -5 |
| Promote food from sustainable sources | 14 | 18 | +4 | 18 | 14 | -4 |
| Reduce Carbon emissions | 17 | 14 | -3 | 16 | 15 | -1 |
| Manage areas for wildlife | 28 | 40 | +12 | 20 | 22 | +2 |
| Promote the UN’s SDGs | 16 | 17 | +1 | 13 | 15 | +2 |
| Embed sustainability in the curriculum | n/a | 15 | n/a | n/a | 14 | n/a |
| Provide Carbon Literacy training | n/a | 13 | n/a | n/a | 12 | n/a |
The table shows that staff are generally more likely than students to rate the university’s sustainability efforts as “very good”, with staff particularly impressed by efforts relating to the promotion of recycling and the management of campus areas for wildlife (particularly in 2022 where 40% acknowledged this). These results can generally be attributed to staff having greater awareness of sustainability initiatives as highlighted in the previous section.
Overall, very few staff or students rated any of the University’s sustainability efforts in 2022 as “very poor” (<9%).
As the University of Worcester is sector-leading on many of its initiatives it is clear that more publicity is required to ensure students understand how much work is being done on-site to enhance sustainability across the board.
Sustainability Related Behaviour
The 2022 survey indicates that with the exception of light motion sensors and renewable energy systems, staff continue to have greater access to sustainability-related facilities in their homes than students. The majority of staff continue to have very high levels of access to recycling bins (99%), programmable thermostats (88%) and LED light bulbs (>90%). Whilst just over half have access to a compost bin (54%). Fewer use water-saving items (36%) or have renewable energy systems (9%). There was very little change (<±3%) in staff access to these facilities between 2021 and 2022 (see Table 4). In contrast, there was more variation in student access to such facilities, with seemingly far less access in 2022 to a compost bin (-10% in 2022 to 34%) and light motion sensors (-15% in 2022 to 31%). However, student access to programmable thermostats and LED light bulbs both rose 10% in 2022 (to 65% and 51% respectively).
Table 4 – Percentage of Staff and Student access to sustainability-related facilities in their homes
| % Staff “Yes” | % Students “Yes” | |||||
| 2021 | 2022 | % change | 2021 | 2022 | % change | |
| Recycling bins | 100 | 99 | -1 | 29 | 27 | -2 |
| Compost bin | 56 | 54 | -2 | 44 | 34 | -10 |
| Programmable thermostat (e.g., boiler timer/temp setting) | 91 | 88 | -3 | 55 | 65 | +10 |
| Water-saving items (e.g., low-flow showerheads) | 36 | 36 | 0 | 22 | 25 | +3 |
| Light motion sensors – inside only not outside lights | 16 | 15 | -1 | 46 | 31 | -15 |
| LED light bulbs | 92 | 90 | -2 | 41 | 51 | +10 |
| Renewable energy systems, (e.g., solar PV panels / hot water) | 7 | 9 | +2 | 11 | 12 | +1 |
Differences can be explained to some extent by potential differences in housing tenure between the two groups, with students far more likely to be living in HMOs, and therefore have less decision-making and control over heating, lighting and water systems. The results indicate that more work can be done with staff and students encouraging home composting and encouraging the implementation of water-saving items.
It is also important to note that the survey question asks whether they ‘have’ the following in their home rather than whether they ‘use’ the following in their home. This might therefore be capturing intent rather than action, so could be adjusted for accuracy in future surveys. It might also be interesting to see whether staff and students are deliberately selecting their electricity supply from renewable sources.
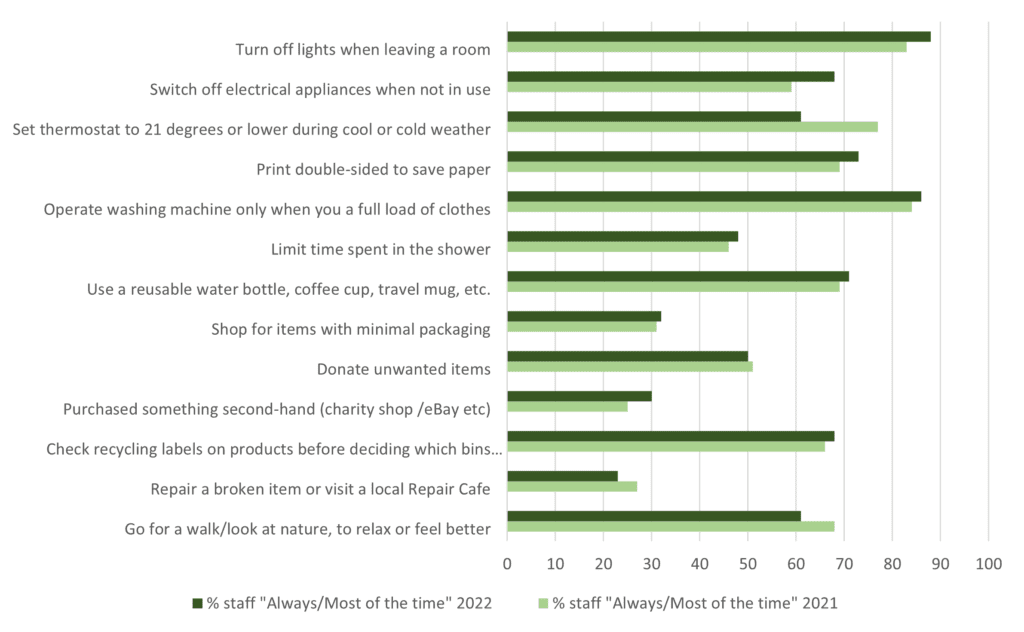
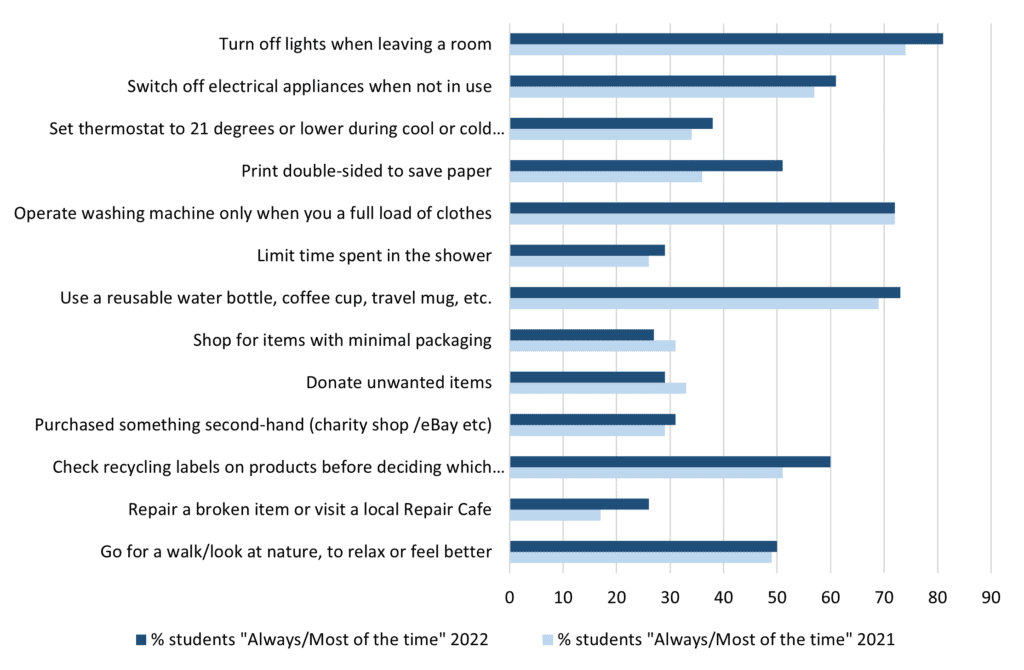
The frequency of undertaking a range of sustainability-related behaviours to ‘Always / Most of the time’ saw a rise amongst staff and students in 2022, see figures 3 and 4.
The results show that, with the exception of setting the thermostat lower, donating unwanted items, repairing items, and going for a walk, the majority of staff are more frequently undertaking sustainability behaviours ‘always or most of the time’ compared to 2021. These exceptions are surprising considering the cost-of-living crisis and the COVID-10 pandemic. The results also indicate that there are still plenty of opportunities for staff to engage more fully with sustainability-related behaviours, particularly minimising packaging, purchasing second-hand products and repairing items (for which less than a third were opting to do these always / most of the time).
The results show a similar positive trend amongst students, with the exception of shopping to minimise packaging, donating unwanted goods and operating the washing machine only on a full load, students are more frequently undertaking all other sustainability behaviours than they did in 2021. This was particularly more evident for careful recycling, repairing, turning the lights off and printing double-sided, which all saw gains exceeding 5%.
Whilst in the majority of cases staff undertook more sustainability-related behaviours more frequently than students in 2022, there were a number of exceptions including using a reusable drink container (+2%), purchasing second-hand items (+1%) and repairing broken items (+3%). Despite improvements in the frequency of behaviours highlighted, there are still clear gains to be made by encouraging wider take up of all these activities amongst the staff and student communities.
Next steps for the University of Worcester after this survey
“The Worcester Students’ Union will continue to commit to being a sustainable business, as well as offering tools to students to also feel confident to be able to deal with different sustainable issues.
We will do this by taking on feedback from students, by creating and promoting volunteering opportunities as well as supporting campaigns and events that our student body is interested in.
We will also work with the Networks, particularly the Sustainability Network to bring together students and ideas to champion the work of Students to ensure that our work as an SU is student-led.” https://www.worcsu.com/pageassets/yourunion/sustainability/Sustainability-Skills-Survey-Results-2022.pdf
A full action plan of actions where the Students’ Union and University work together to improve knowledge and awareness of sustainability can be read here https://www.worcester.ac.uk/documents/RF-project-plan-2022-2024.docx

2020-21 Survey data
We were pleased to find for the most part that awareness of on-campus sustainability measures was not hugely deteriorated due to the pandemic. Almost all of our figures reflect more sustainable behaviours at the university, compared to previous years.
Covid-19 has had a large impact on our student body and our behaviours. So, it is encouraging to know that the information is still getting out to students.
Worcester’s Awareness of The Sustainable Development Goals has Increased
Our SDG’s (Sustainability Development Goals) are becoming more well known, as students and staff are starting to hear more and know more about these goals.
There are 17 SDGs that the university is working towards. They aren’t solely focused on environmental goals, instead, we also look at the social and economic side of university life. This is because the best way to enable and ensure a greener future is by allowing everyone to have access to a sustainable way of living.
Students’ Awareness of Sustainability is on the Increase
Awareness of SDGs:
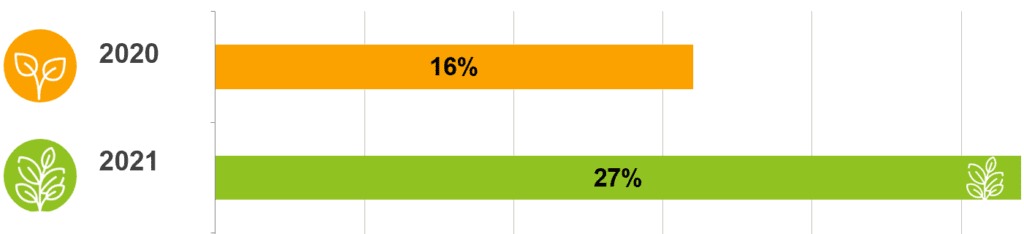
Students are increasingly becoming aware of our sustainable development goals. We have seen a rise by 11% of students claiming to know a fair amount about them. Last year, only 16% of respondents selected to know a fair amount, to a lot about our SDGs. Whereas this year, it has risen to 27%. We would love to see these figures climb even higher. So, if you are interested, have a read of Worcester Students’ Union have a fact sheet SDG page.
A Mixed Result for Sustainability Focussed Devices for Students
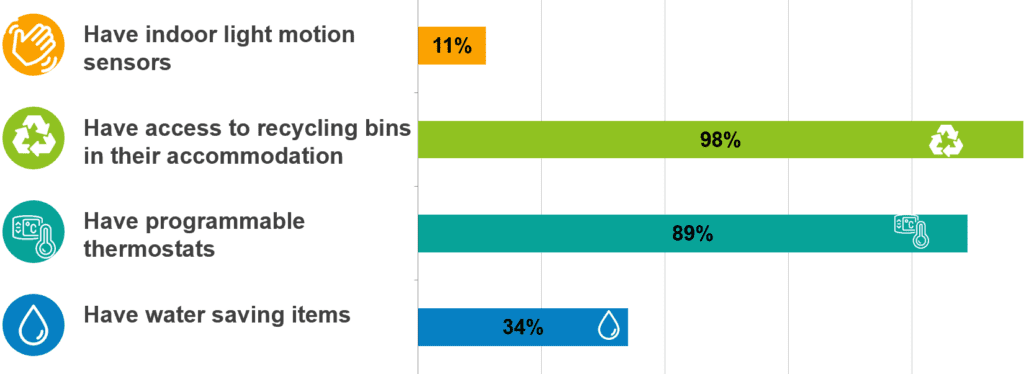
Use of Sustainable Devices:
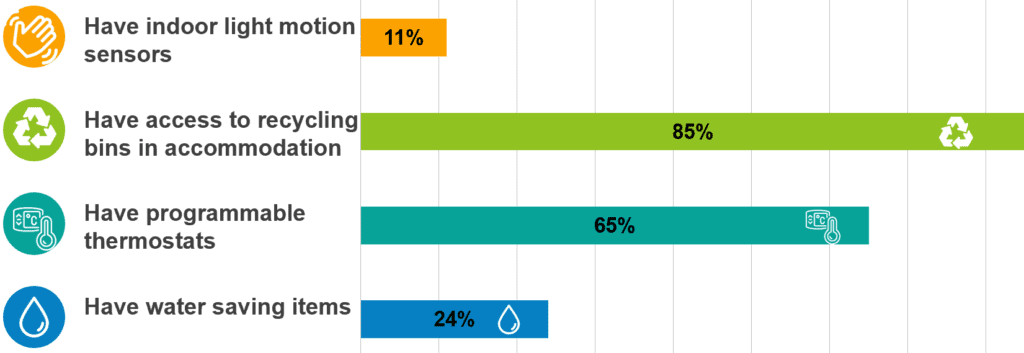
As shown in the graph above, the number of ways students can be supported in living sustainably varies. At 85%, recycling bins were unsurprisingly the most common listed item. Only 11% of responses claimed to have indoor light motion sensors. 65% have a programable thermostat and 24% have water-saving devices. We understand that these differences could be due to the increased number of students living in shared student houses rather than in university halls or at home.
Walking to Relax is on the Increase for Students
Walking to Relax:
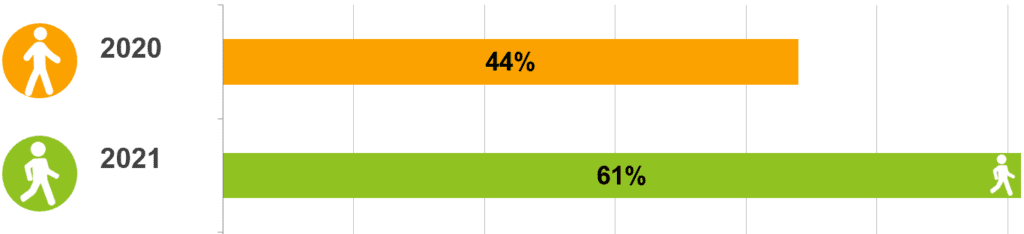
A habit from lockdown tracked in the surveys is walking. It is great to see more students staying active and taking regular walks in nature to relax. This rise has moved from 44% of students to 61%. It is a great act of sustainability. As it is not a habit that increases our carbon footprints.
Walking is a brilliant habit we encourage in Worcester, especially the walk between our St Johns and City campuses. Taking 15 minutes to stroll between campuses can be a great way to fit in regular light exercise during the busy life of a student.
Staff Awareness of Sustainability is on the Increase
Awareness of SDGs:
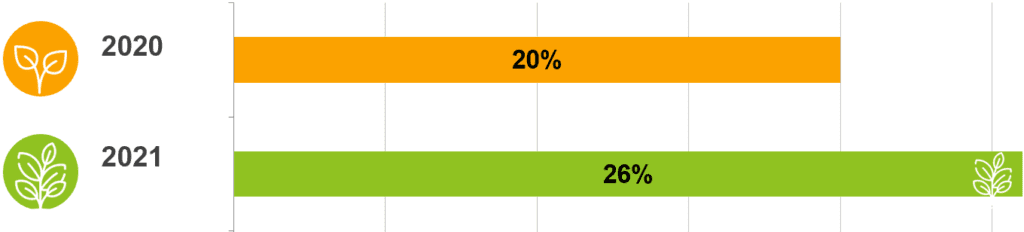
Graph comparing figures from 2020 to 2021 by Aleksandr Mäeots
With efforts to push our sustainability development goals beyond SusThingsOut, through embedding them into the curriculum and further activities, we are seeing a rise in staff awareness. 26% of staff felt they knew a fair amount about our SDGs compared to just 20% last year.
A Mixed Result for Sustainability Focussed Devices for Staff
Use of Sustainable Devices:
Almost all of our staff have a recycling bin at home, only 2% without. Staff are also racing ahead with 89% owning a programmable thermostat. And 10% more staff have water-saving devices than students. These differences between staff and students are expected as student living is often not a permanent place of residence and the income of a student is typically much smaller.
However, students and staff are level with only 11% owning Indoor light motion sensors.
Walking to Relax is on the Increase for Staff
Walking to Relax:
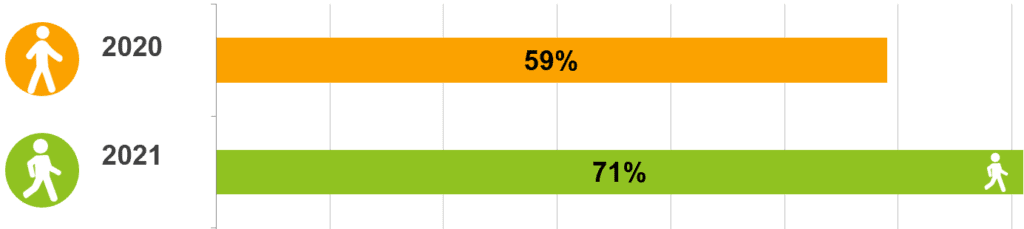
There has also been a great improvement in walking among staff. With 71% claiming they walk regularly to relax, as opposed to just 59% before. The university mile has been used more too! If you’re not familiar with this, have a look at one of our university maps of the St Johns campus. Walking this route is a great way to clock how far you are going!
Overall, it is fair to say that the work put in by many to increase knowledge and awareness is paying off, even with the challenges from the pandemic. Both staff and students are learning and growing. We can be proud of this progress and aim for even more growth for the future.
If you are interested in reading the full report, please see the link below.